Raw data in. Decisions out.

Brisbane, QLD · Available now

Analytics Engineer. I build data pipelines and models with Databricks, PySpark, SQL and AWS, so Finance and Operations teams get numbers they can trust in Power BI.

The medallion architecture I use: records move from raw to cleaned to business-ready.Move your pointer over the raw zone
Based in
Brisbane, Queensland
Experience
6 years in data roles
Australian experience
World Courier, Brisbane
Industries
Logistics, banking, construction, brewing
Certified
4× Microsoft, incl. DP-600 & PL-300
Kevin Paes sitting in a grey armchair, wearing a black shirt, looking at the camera
About me

I'm Kevin, a data professional from Brazil, now living in Brisbane.

I started in operations, on a brewery production floor, working every day in SAP. Since then I have built dashboards, ETL pipelines and Lakehouse platforms for banking, construction and manufacturing companies. In Brisbane, I supported the office of World Courier, a global logistics company, with data projects.

I like work where the data is messy and the business question is clear. My job is to connect the two.

How I work

Three layers between a messy source and a clear answer.

I started on a brewery production floor, counting stock against SAP. I know what bad data costs people on the ground. So every project follows the same path.

Bronze · Land

Keep the raw data, untouched.

Ingest every source as it arrives, so any number can be traced back to where it came from.

Pulled production data from SAP PP across 7 manufacturing plants.

Silver · Clean

Fix, join and test it.

Remove duplicates, align keys and types, and add quality checks before anyone builds a report on top.

Built ETL in Pentaho and PySpark to make data consistent across sites.

Gold · Model

Shape it for the decision.

Model fact and dimension tables around real business questions, then tune them for fast dashboards.

Delivered Power BI models for Finance, Commercial and Operations teams.

Selected work

Nine selected projects, from Australia and Brazil.

I have built many more dashboards and data pipelines. These are some I chose to show. Open any project to read the full story in English, with the live dashboard. All numbers are changed to protect confidential data. Ask me if you would like to see more.

AUAustralia · Brisbane

BRBrazil

Grupo Petrópolis · 2023–2025

A water indicator for 7 breweries

One water efficiency indicator for every plant, compared with targets and plans, for sustainability reporting.

Grupo Petrópolis · 2017–2021 data

Logistics KPIs: on time, in full

OTIF, order cycle time and delivery problems by reason and by branch, across five years of orders.

Power BIDAXPower QueryOracle SQL
Learn more about logistics kpis: on time, in full
Experience

From the plant floor to the Lakehouse, and now Brisbane.

Every role added a layer: operations first, then reporting, then the platform underneath.

  1. May 2026 – Aug 2026

    Warehouse Assistant, Data Projects

    World Courier (Cencora) · Brisbane, QLD · Contract

    Supported the Brisbane office of a global specialty logistics company. Built Power BI reports on packaging use and third-party carrier costs, alongside daily warehouse work.

  2. Jan 2026 – May 2026

    Analytics Engineer

    Ilegra, for Tenda (construction & real estate) · Remote

    Led the move of a legacy data platform to a Databricks and AWS Lakehouse with Medallion layers in Delta Lake.

  3. Mar 2025 – Dec 2025

    Data Analyst

    Ilegra, for Banco BV (banking) · Remote

    BigQuery datasets, Power BI dashboards, A/B tests and insight reports for senior stakeholders.

  4. Jul 2023 – Mar 2025

    Corporate Data Analyst

    Grupo Petrópolis · Boituva, SP, Brazil

    Corporate KPIs for 7 plants from SAP PP, a water consumption indicator, and Pentaho ETL.

  5. Sep 2023 – Dec 2023

    Power BI & Excel Instructor

    SENAC Bahia

    Taught Power BI and data analytics to working professionals, from beginner to advanced.

  6. Nov 2022 – Jul 2023

    Power Platform Developer

    Grupo Petrópolis · Alagoinhas, Bahia, Brazil

    ETL into the corporate data warehouse, a fleet app in PowerApps, and Power Automate alerts.

  7. Nov 2020 – Nov 2022

    MIS Assistant

    Grupo Petrópolis · Alagoinhas, Bahia, Brazil

    Daily work in SAP PP: production orders, materials and stock. Matched system records to physical counts and automated routines with VBA.

Toolkit

The tools I use every day.

Dark chips are my core stack.

Data platform
DatabricksDelta LakeApache SparkMedallion architecture
Languages
Python (PySpark)Spark SQLDAXPL/SQLPower FxVBA
Cloud
AWS (S3, Redshift)Google Cloud (BigQuery, Vertex AI)Firebase
Databases
SQL ServerOracleMySQLRedshiftBigQuery
BI & ETL
Power BIMicrosoft FabricLooker StudioPentahoOracle Data Integration
Business systems
SAP ERP (PP)Power AppsPower AutomateExcel & Power QuerySharePoint
Ways of working
Git & GitHubScrumKanbanFigma
Credentials

Certified, and still learning.

Certifications

  • DP-600Microsoft Fabric Analytics Engineer AssociateVerify Dec 2025
  • PL-300Microsoft Power BI Data Analyst AssociateVerify Oct 2025
  • GH-900GitHub FoundationsVerify Sep 2025
  • PL-900Microsoft Power Platform FundamentalsVerify Sep 2025
  • Databricks Fundamentals2025

Education

  • Postgraduate, Data Science and Big Data Analytics
    Faculdade Metropolitana
    2023
  • MBA, Business Management and Competitive Intelligence
    Universidade Tiradentes
    2020–21
  • Bachelor, Systems Analysis and Development
    Universidade Tiradentes
    2017–20
  • Technician, Electromechanics
    SENAI CIMATEC
    2018–20
Contact

Need clean data in your team? Let's talk.

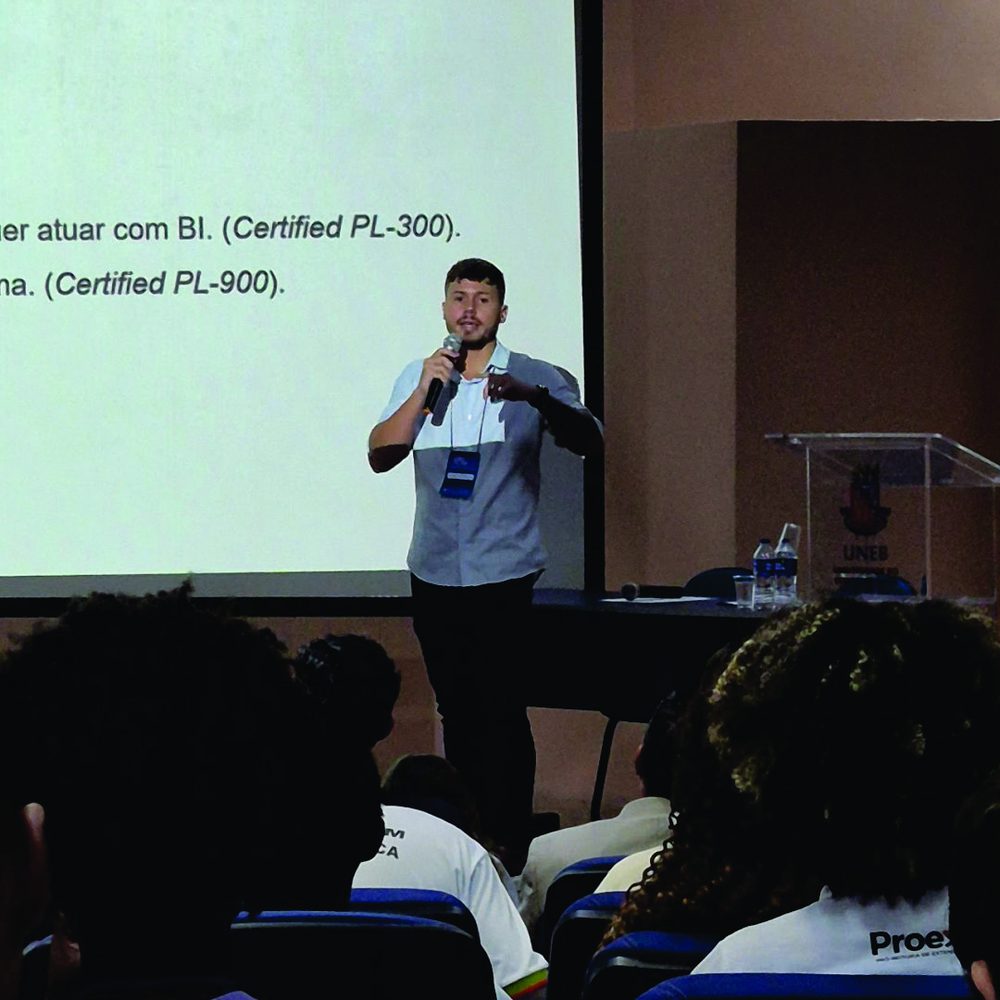
Kevin speaking with a microphone in front of a projected slide at a university event

Giving a talk about working in BI at UNEB, a university in Bahia, Brazil.

I live in Brisbane and can start now. I'm happy to meet for a coffee, do a technical interview, or walk you through a project.

kevin.ssa@gmail.com
+61 485 681 095
Brisbane, QLD, Australia
All projects
Australia · World Courier (Cencora)

Comparing the cost of two third-party carriers

World Courier moves time-critical and temperature-controlled shipments. The Brisbane office uses two third-party carriers, called Phoenix and Yellow in the report. The team wanted to know which carrier gives better value, and on which routes.

Open the live dashboardOpens Power BI in a new tab. The report labels are in English.

All numbers in this dashboard are changed to protect privacy and confidential data. The design and logic are my real work.
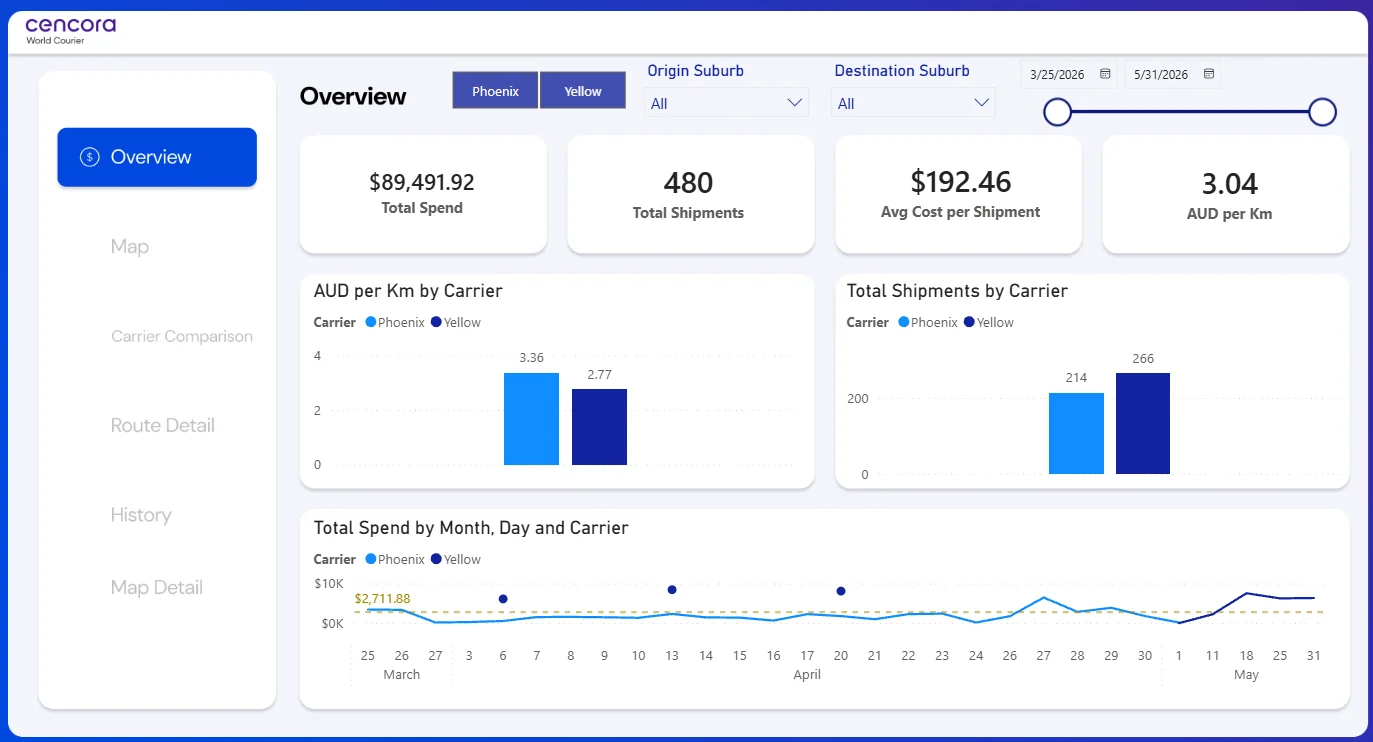
Power BI overview page comparing carriers Phoenix and Yellow: total spend, shipments, average cost per shipment and AUD per km, with charts by carrier and spend by day.
Client
World Courier (Cencora)
Context
Brisbane, QLD
When
2026
My role
Warehouse Assistant with a focus on data projects
Tools
Power BIDAXPower QueryMap visuals

The problem

Carrier costs were spread across invoices and shipment records. Nobody could quickly answer simple questions: How much do we spend with each carrier? What does one shipment cost? Which routes are expensive per kilometre?
What I built

  • Joined shipment records with carrier costs and route distances in one model.
  • Created the main measures in DAX: total spend, shipments, average cost per shipment and AUD per km.
  • Built six report pages: Overview, Map, Carrier Comparison, Route Detail, History and Map Detail.
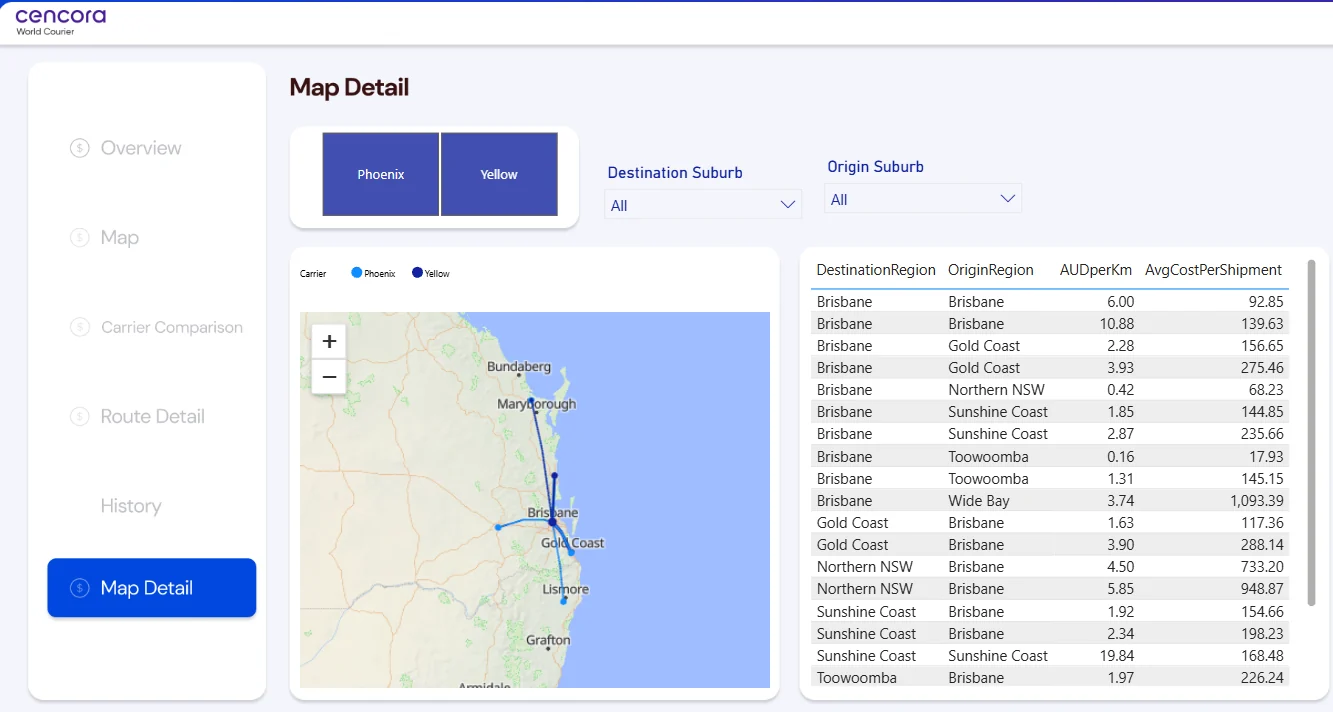
  • Added map views of each route, from Brisbane to the Gold Coast, Sunshine Coast, Toowoomba, Wide Bay and Northern NSW.
  • Added filters for carrier, origin suburb, destination suburb and date, plus an average line on daily spend.

Key measures

Total Spend
All carrier charges in the selected period, in AUD.
Average cost per shipment
Total spend divided by the number of shipments.
AUD per km
Total spend divided by total kilometres. This lets you compare short and long routes fairly.
Spend by day
Daily spend for each carrier, with the period average as a reference line.
Map Detail page: routes on the map and a table of cost per km and average cost per shipment for each origin and destination region.
All projects
Australia · World Courier (Cencora)

Tracking packaging use for temperature-controlled shipments

Medicines and clinical trial samples travel in special packaging: dry ice boxes, dry shippers, pallets and insulated boxes. Each type keeps a different temperature. This report shows how the Brisbane office uses that packaging every day.

Open the live dashboardOpens Power BI in a new tab. The report labels are in English.

All numbers in this dashboard are changed to protect privacy and confidential data. The design and logic are my real work.
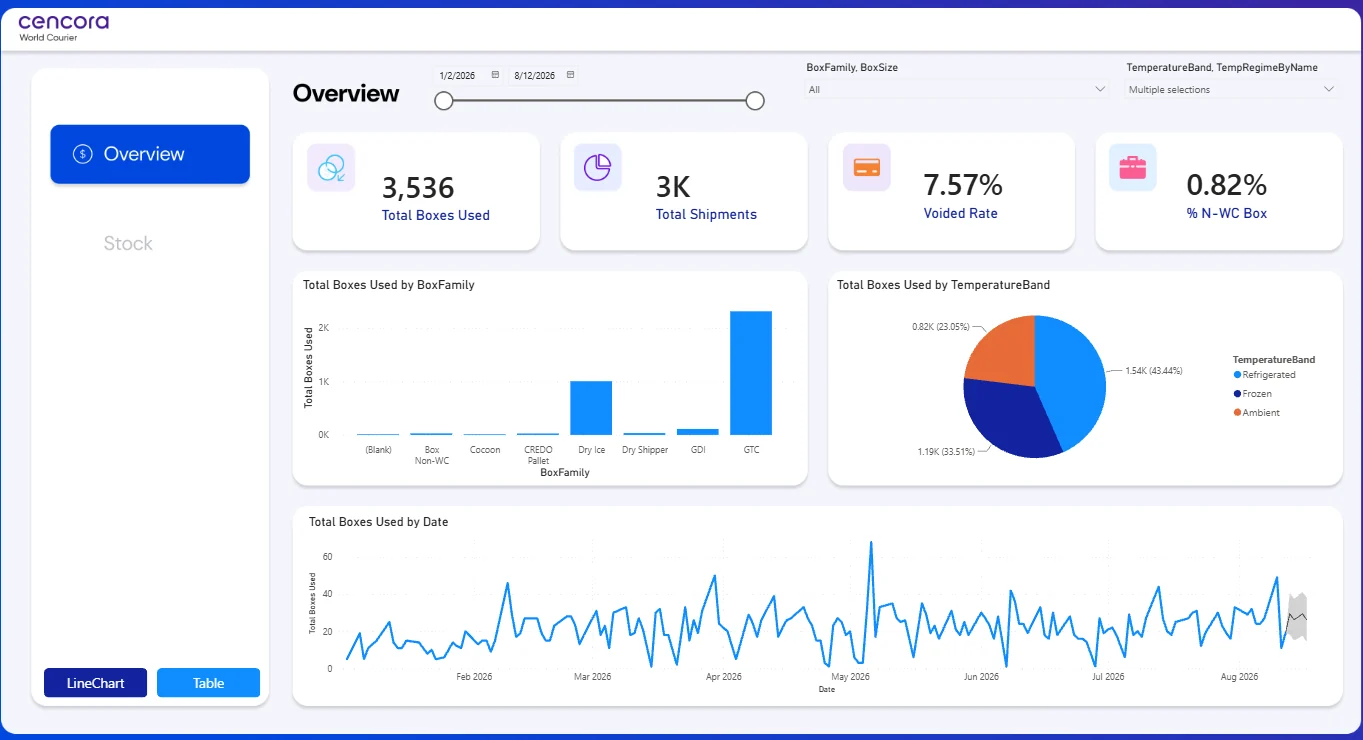
Power BI overview page: total boxes used, total shipments, voided rate and percent of non-World Courier boxes, with charts by box family, by temperature band and by date.
Client
World Courier (Cencora)
Context
Brisbane, QLD
When
2026
My role
Warehouse Assistant with a focus on data projects
Tools
Power BIDAXPower QueryForecasting

The problem

Packaging is expensive, and running out of the right box can delay a shipment. The team needed a clear view of which box families they use, for which temperature bands, and how use changes over time.

What I built

  • Modelled box usage by box family, box size, temperature band and date.
  • Built KPI cards for total boxes used, total shipments, voided rate and share of non-World Courier boxes.
  • Showed use by box family and by temperature band (refrigerated, frozen and ambient).
  • Added a daily trend with a short forecast, to help plan stock.
  • Built a separate Stock page and a simple start page with navigation.

Key measures

Total Boxes Used
Number of boxes used in shipments in the selected period.
Voided Rate
Share of boxes that were voided, for example when a shipment was cancelled or repacked.
% N-WC Box
Share of boxes that are not World Courier's own packaging (the "Box Non-WC" family).
Temperature band
Refrigerated, frozen or ambient. Each band needs different packaging.
Start page of the report, with navigation to Overview and Stock.
All projects
Brazil · Tenda via Ilegra

Moving a legacy data platform to a Lakehouse

Tenda is one of Brazil's largest home builders. Its data platform had grown over many years, and reports were slow and hard to trust. I worked on the team that moved it to a modern Lakehouse. It was a very large project, with data from finance, sales and construction operations.

I can't show the real system or data, because they belong to the client. The diagram and code below are examples I made for this portfolio to show how this kind of platform works.

Illustration: source systems land in AWS S3, move through Bronze, Silver and Gold Delta tables in Databricks, then feed Power BI models for Finance, Commercial and Operations. SOURCES ERP (finance) Sales & CRM Construction ops Legacy databases Spreadsheets LAND AWS S3raw files DATABRICKS · DELTA LAKE · PYSPARK + SPARK SQL Bronzeraw copy+ load datefull history Silvertypes fixedduplicates outquality checks Goldfacts anddimensionsbusiness KPIs scheduled jobs · data quality rules · access control USE Finance Commercial Operations Power BI models Illustration made for this portfolio. Source names are examples; the client's real systems are confidential.
Architecture illustration, made for this portfolio.
Client
Tenda via Ilegra
Context
Construction & real estate · Remote
When
2026
My role
Analytics Engineer
Tools
DatabricksPySparkSpark SQLDelta LakeAWS S3Power BI

The problem

Data lived in many legacy systems. Each report rebuilt the same logic in its own way, so numbers did not match between teams. Pipelines were slow, and it was hard to know where a number came from.

What I built

  • Designed and built distributed pipelines in PySpark and Spark SQL for financial and operational data.
  • Set up the Medallion layers in Delta Lake: Bronze for raw data, Silver for cleaned data, Gold for business models.
  • Modelled analytical datasets (facts and dimensions) for Finance, Commercial and Operations.
  • Connected Databricks to Power BI and tuned the datasets so reports load faster.
  • Added quality rules between layers, so problems are caught before they reach a report.

Example code

A short PySpark example of the kind of logic I wrote. It is not the client's code.

# Example only: Silver layer job, written for this portfolio
from pyspark.sql import functions as F

bronze = spark.read.table("bronze.finance_invoices")

silver = (
    bronze
    .withColumn("invoice_date", F.to_date("invoice_date", "yyyy-MM-dd"))
    .withColumn("amount", F.col("amount").cast("decimal(18,2)"))
    .filter(F.col("invoice_id").isNotNull())
    .dropDuplicates(["invoice_id"])
)

# Simple quality gate before the table is published
assert silver.filter(F.col("amount") < 0).count() == 0

silver.write.format("delta").mode("overwrite").saveAsTable("silver.finance_invoices")
All projects
Brazil · Banco BV via Ilegra

Analytics for a bank's Finance and Operations teams

Banco BV is one of Brazil's biggest banks for vehicle finance. I worked with its Finance and Operations teams, who needed reliable data and clear reports from very large volumes of transactions.

I can't show the bank's real dashboards or data. The diagram and SQL below are examples I made for this portfolio to show the type of work.

Illustration: transaction data loads into Google BigQuery, is shaped into analytical datasets with SQL and Python, then feeds Power BI dashboards and insight reports. A separate Power Platform app tracks data school certificates. SOURCES Transactions Finance systems Operations data GOOGLE BIGQUERY Stagingraw tables CleanSQL models DatasetsKPIs by team USE Power BI dashboards A/B tests & backtestsSQL + Python Insight reports for leaders Power Platform app · data school certificates Illustration made for this portfolio. The bank's real systems and data are confidential.
Architecture illustration, made for this portfolio.
Client
Banco BV via Ilegra
Context
Banking · Remote
When
2025
My role
Data Analyst
Tools
Google BigQuerySQLPythonPower BIPower AppsPower Automate

The problem

Leaders needed one trusted view of key numbers. Some processes and reports were not reliable, and the bank's internal data school tracked certificates by hand.

What I built

  • Built analytical datasets in Google BigQuery and connected them to Power BI dashboards.
  • Analysed large transaction data with SQL and Python, using statistics to find useful insights.
  • Ran A/B tests and backtests to check changes before rollout, improving reliability and report accuracy.
  • Built a Power Platform app to manage certificates for the bank's data school, replacing manual tracking.
  • Wrote regular insight reports for senior stakeholders on the data maturity programme.

Example code

A short BigQuery SQL example of the kind of logic I wrote. It is not the client's code.

-- Example only: compare a test group with a control group
SELECT
  test_group,
  COUNT(*)                         AS customers,
  AVG(processing_hours)            AS avg_processing_hours,
  COUNTIF(report_error) / COUNT(*) AS error_rate
FROM analytics.process_experiment
WHERE run_date BETWEEN '2025-06-01' AND '2025-08-31'
GROUP BY test_group;
All projects
Brazil · Grupo Petrópolis

A water indicator for 7 breweries

Grupo Petrópolis is one of Brazil's largest brewing groups. Breweries use a lot of water, so the company wanted one way to measure water efficiency in all 7 plants.

Open the live dashboardOpens Power BI in a new tab. The report labels are in Portuguese; the translation guide is below.

All numbers in this dashboard are changed to protect privacy and confidential data. The design and logic are my real work.
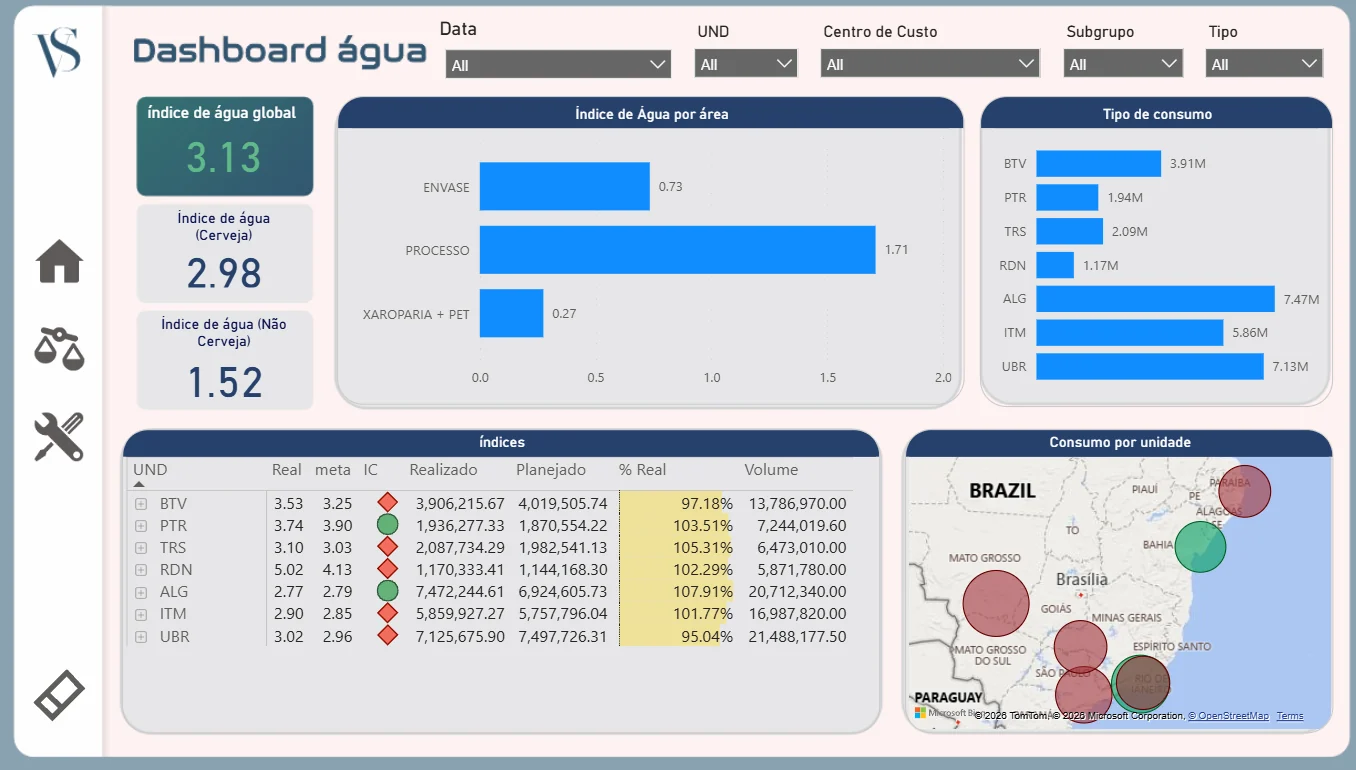
Power BI water dashboard in Portuguese: global water index 3.13, beer and non-beer indexes, index by area, consumption by plant, a table of actual versus target by plant, and a map of Brazil.
Client
Grupo Petrópolis
Context
Brewing · 7 plants across Brazil
When
2023–2025
My role
Corporate Data Analyst
Tools
Power BIDAXSAP PPPentaho

The problem

Each plant measured water in its own way, so plants could not be compared. Leaders also needed the numbers for sustainability reporting.

What I built

  • Led the design of a water index: water used for each unit of drink produced.
  • Split the index by area: packaging, brewing process, and syrup room plus PET bottling.
  • Compared each plant's actual index with its target, with green and red status icons.
  • Compared actual water use with the plan, and showed production volume next to it.
  • Added a map of Brazil sized by consumption, and filters for date, plant, cost centre and type.

Key measures

Global water index
Water used divided by production, for all plants. Lower is better.
Beer / non-beer index
The same index, split into beer and other drinks.
Actual vs target
Each plant's index against its goal. Green means on target.
% of plan
Actual water use divided by planned water use.

Translation guide

The dashboard was built in Portuguese. Use this table to read the screen.

On screen (Portuguese)In English
Dashboard águaWater dashboard
Índice de água globalGlobal water index
Cerveja / Não cervejaBeer / non-beer
Índice de água por áreaWater index by area
EnvasePackaging line
ProcessoBrewing process
Xaroparia + PETSyrup room + PET bottling
Tipo de consumoConsumption by plant
UNDPlant (unit)
Real / metaActual / target
ICStatus icon
Realizado / PlanejadoActual / planned volume
Consumo por unidadeConsumption by plant
Data / Centro de custo / Subgrupo / TipoDate / cost centre / subgroup / type
All projects
Brazil · Grupo Petrópolis

A corporate quality dashboard, from SAP to Power BI

ICP is the group's corporate quality indicator for brewing. It shows what share of quality checks meet the standard, from the brewing process to packaging and the finished product. I built this project end to end: the data pipeline and the dashboard.

Open the live dashboardOpens Power BI in a new tab. The report labels are in Portuguese; the translation guide is below.

All numbers in this dashboard are changed to protect privacy and confidential data. The design and logic are my real work.
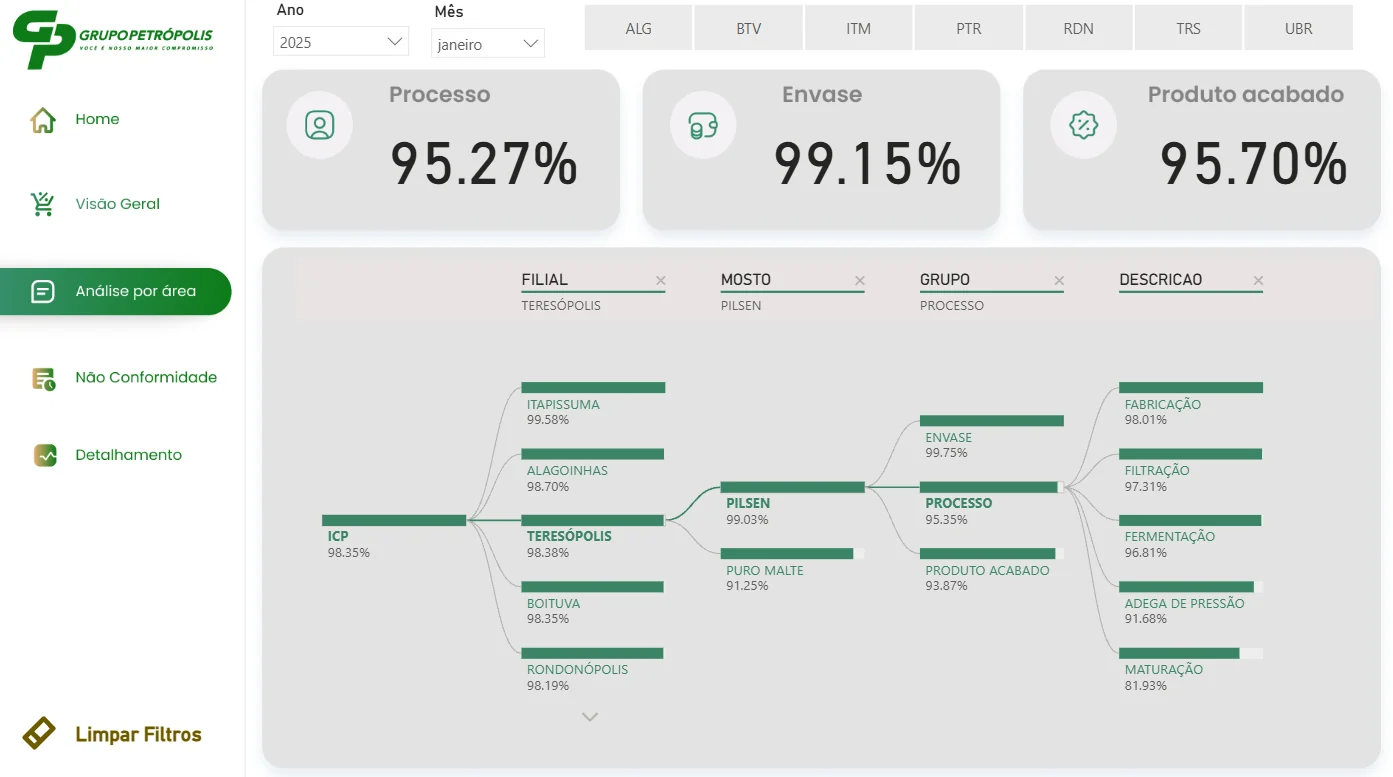
Power BI ICP dashboard in Portuguese: Process 95.27%, Packaging 99.15%, Finished product 95.70%, and a decomposition tree from ICP by plant, wort type, group and process step.
Client
Grupo Petrópolis
Context
Brewing · quality across all plants
When
2024–2025
My role
Corporate Data Analyst
Tools
SAPOracleScheduled loadsPower BIDAX

The problem

Quality results lived in SAP tables at each plant. There was no automatic way to bring them together, so the corporate team could not see quickly which plant, product or process step was pulling quality down.
What I built

  • Designed the data capture from SAP tables into an Oracle database.
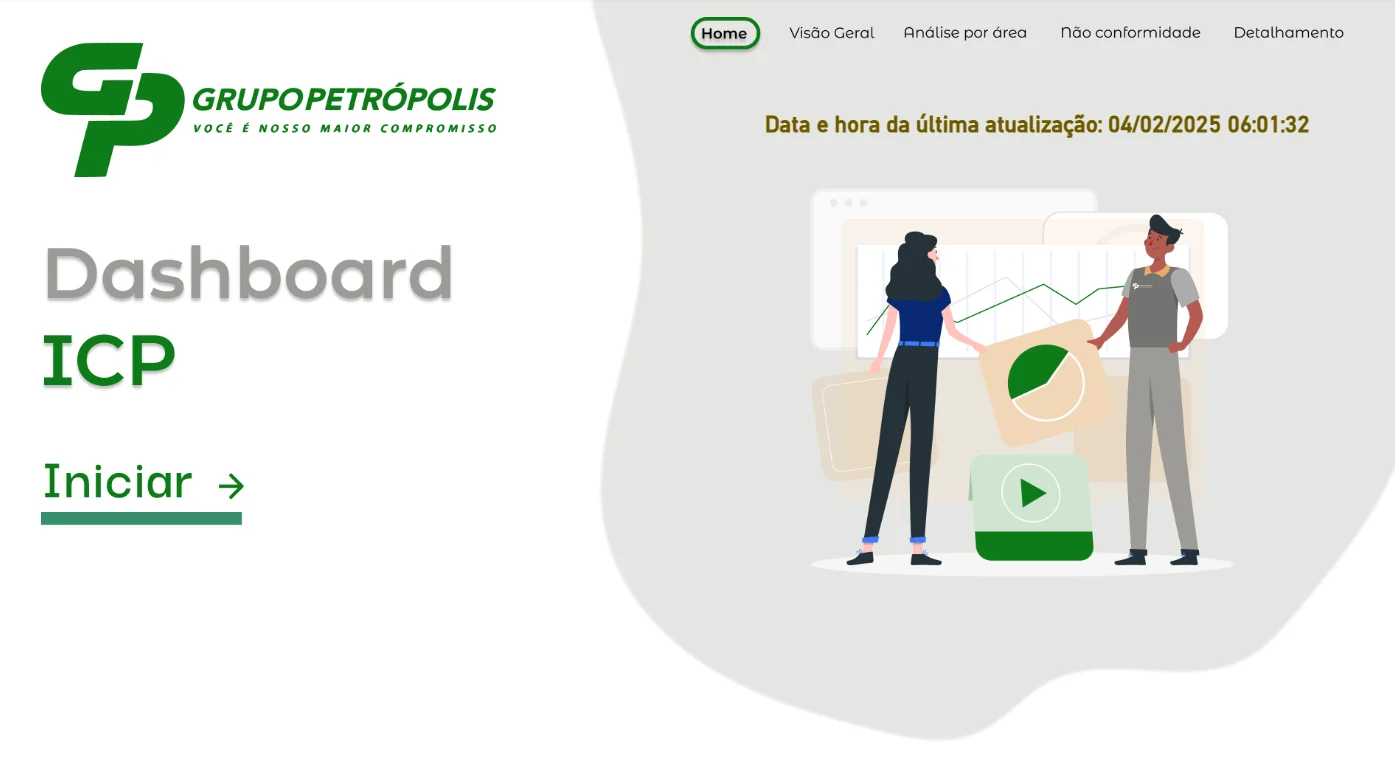
  • Set up scheduled loads, so the data refreshes automatically. The start page shows the date and time of the last update.
  • Modelled the ICP by plant, wort type (Pilsen or pure malt), area and process step.
  • Built a decomposition tree to drill down from the overall ICP to one step, for example maturation in one plant.
  • Added pages for overview, analysis by area, non-conformities and detail, with filters for year, month and plant.

Key measures

ICP
Share of quality checks that meet the standard. Higher is better.
Process / Packaging / Finished product
The same index for each big area of the brewery.
Non-conformity
A quality check that failed, with its area and step.
Start page with navigation and the time of the last data update.

Translation guide

The dashboard was built in Portuguese. Use this table to read the screen.

On screen (Portuguese)In English
Visão geralOverview
Análise por áreaAnalysis by area
Não conformidadeNon-conformity
DetalhamentoDetail
Processo / Envase / Produto acabadoProcess / packaging / finished product
FilialPlant
Mosto: Pilsen / Puro malteWort: Pilsen / pure malt
Grupo / DescriçãoGroup / process step
Fabricação / Filtração / FermentaçãoBrewing / filtration / fermentation
Adega de pressão / MaturaçãoBright beer tanks / maturation
Ano / MêsYear / month
Limpar filtrosClear filters
Data e hora da última atualizaçãoDate and time of last update
All projects
Brazil · Grupo Petrópolis

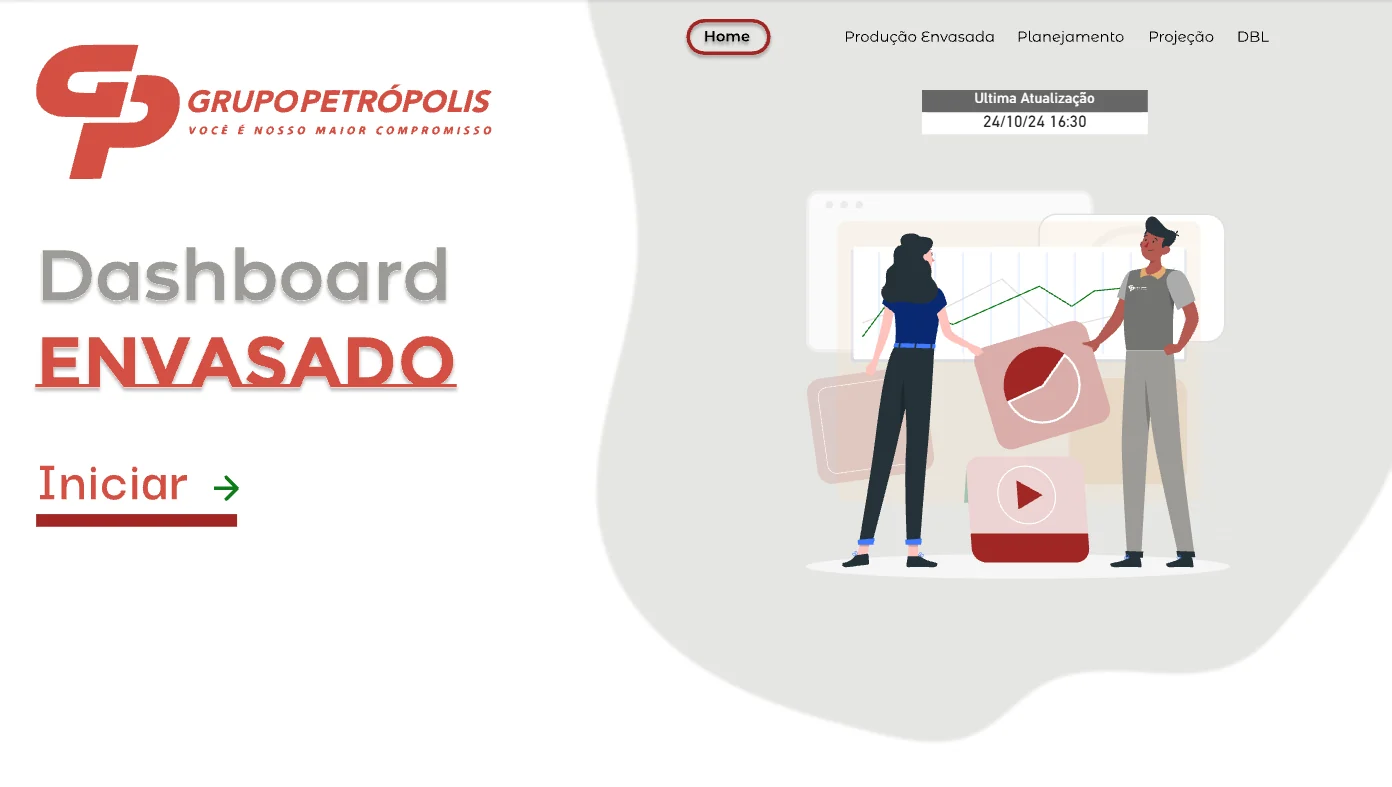
Bottled production: actual vs plan, by plant and line

Packaging is the last step in a brewery: beer and soft drinks go into cans, glass bottles, kegs and PET bottles. This dashboard shows how much each plant packaged, and how that compares with the plan.

Open the live dashboardOpens Power BI in a new tab. The report labels are in Portuguese; the translation guide is below.

All numbers in this dashboard are changed to protect privacy and confidential data. The design and logic are my real work.
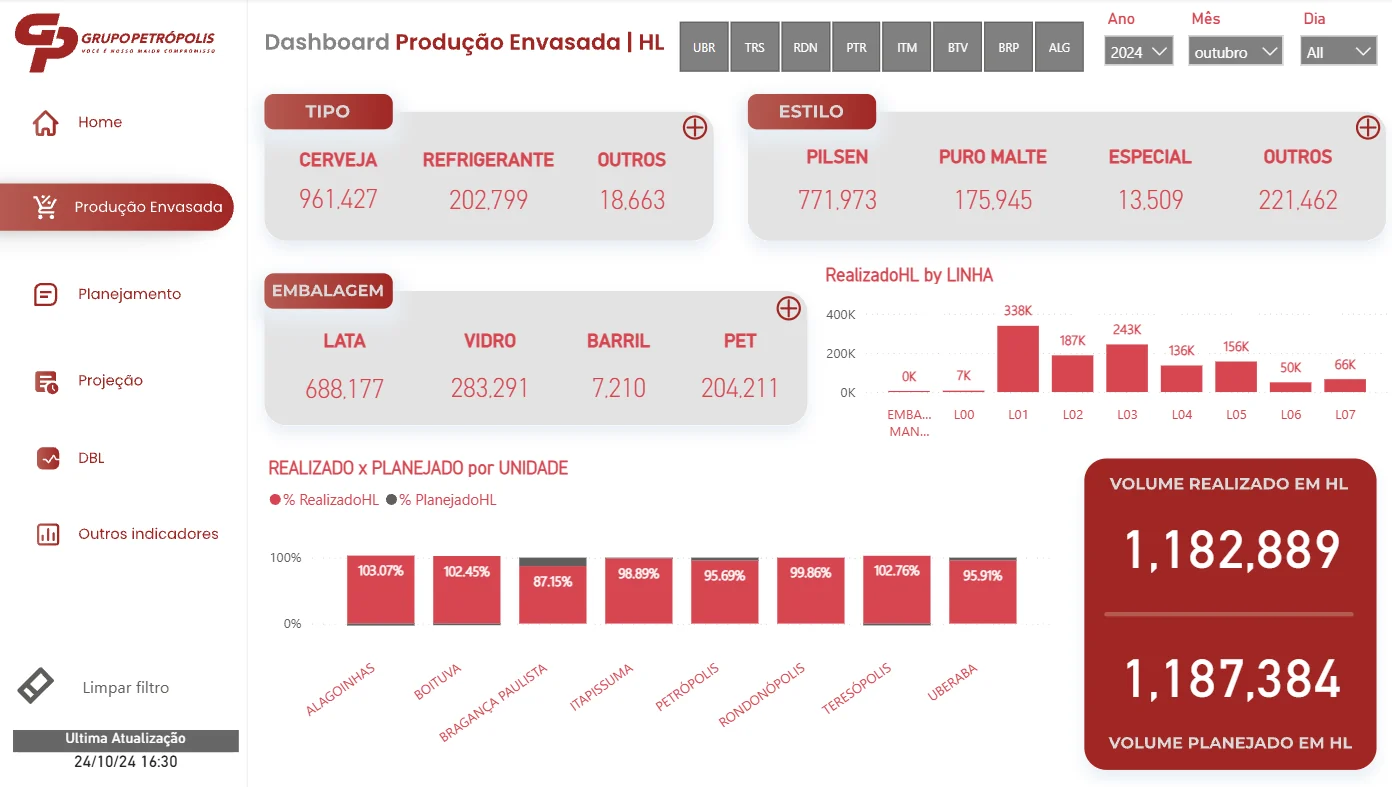
Power BI dashboard in Portuguese: packaged production in hectolitres by type, style and packaging, volume by line, actual versus planned by plant, and total actual 1,182,889 HL versus planned 1,187,384 HL.
Client
Grupo Petrópolis
Context
Brewing · 8 plants
When
2024
My role
Corporate Data Analyst
Tools
SAPOracleScheduled loadsPower BIDAX

The problem

Production planning needed one daily view of packaged volume across all plants and lines, built on the same automated SAP data flow as the quality dashboard.
What I built

  • Reused the SAP to Oracle pipeline with scheduled loads, so the report updates on its own.
  • Showed packaged volume in hectolitres by drink type, beer style and packaging type.
  • Compared actual and planned volume for each plant, and showed volume by production line.
  • Added pages for planning, projection and other indicators, with filters for plant, year, month and day.

Key measures

Actual volume (HL)
Hectolitres packaged in the period. 1 HL = 100 litres.
Planned volume (HL)
The production plan for the same period.
% actual vs plan
Actual volume divided by planned volume, for each plant.
Start page with navigation and the time of the last update.

Translation guide

The dashboard was built in Portuguese. Use this table to read the screen.

On screen (Portuguese)In English
Produção envasadaPackaged production
Planejamento / ProjeçãoPlanning / projection
Tipo: cerveja, refrigerante, outrosType: beer, soft drink, other
Estilo: puro malte, especialStyle: pure malt, special
Embalagem: lata, vidro, barril, PETPackaging: can, glass, keg, PET
Realizado / PlanejadoActual / planned
LinhaProduction line
UnidadePlant
Outros indicadoresOther indicators
Última atualizaçãoLast update
All projects
Brazil · Grupo Petrópolis

Logistics KPIs: on time, in full

A drinks company delivers to thousands of shops and bars. This report shows how well those deliveries perform, and why some orders go wrong.

Open the live dashboardOpens Power BI in a new tab. The report labels are in Portuguese; the translation guide is below.

All numbers in this dashboard are changed to protect privacy and confidential data. The design and logic are my real work.
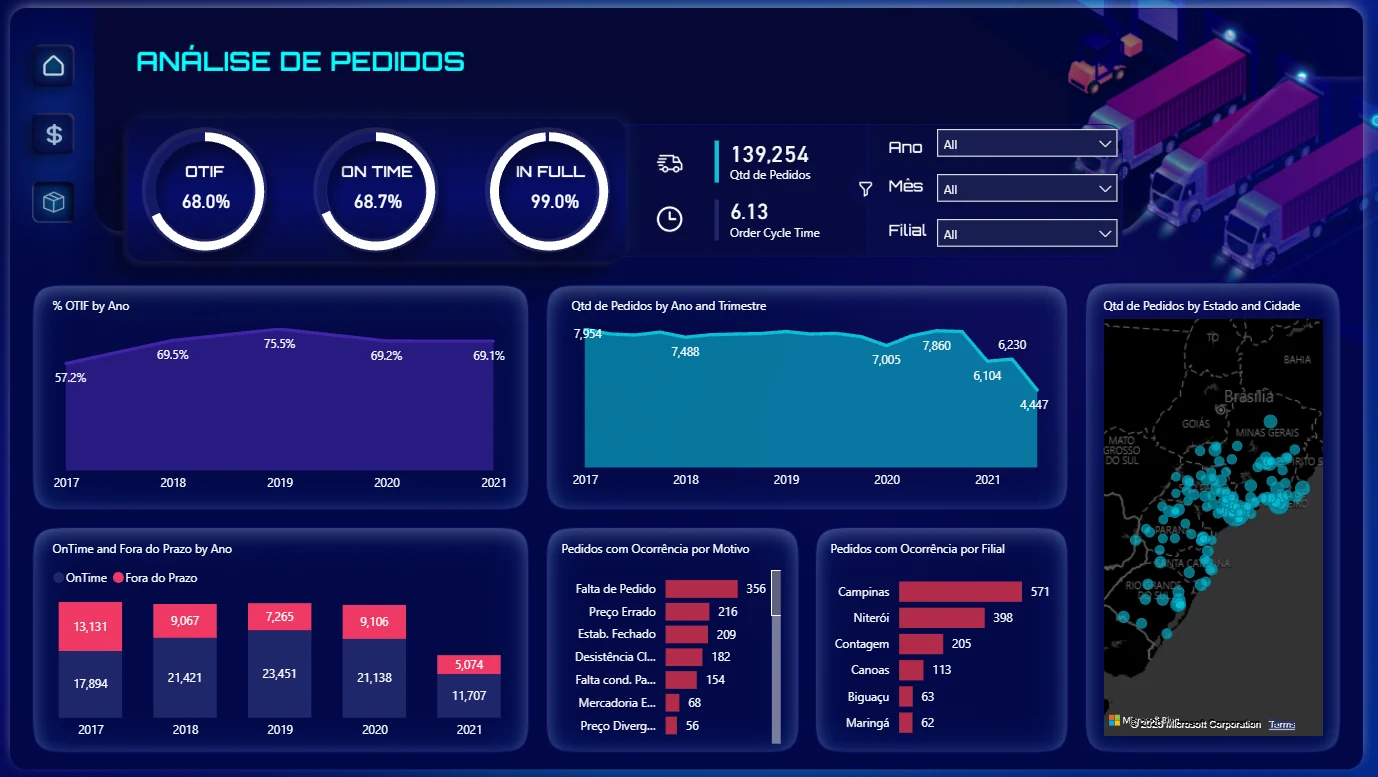
Dark Power BI dashboard in Portuguese: OTIF 68%, on time 68.7%, in full 99%, 139,254 orders, order cycle time 6.13, charts by year, problems by reason and branch, and a map of orders.
Client
Grupo Petrópolis
Context
Logistics
When
2017–2021 data
My role
Power Platform Developer / Data Analyst
Tools
Power BIDAXPower QueryOracle SQL

The problem

The logistics team had delivery data but no single view of service level. They needed to see OTIF over time and find the main reasons for failed or late orders.
What I built

  • Calculated OTIF (On Time In Full), On Time and In Full rates.
  • Showed order volume and order cycle time, with trends by year and quarter.
  • Compared on-time and late orders for each year.
  • Ranked delivery problems by reason (for example missing order, wrong price, shop closed) and by branch.
  • Mapped orders by state and city, with filters for year, month and branch.

Key measures

OTIF
Share of orders delivered on time and complete. The main service level KPI.
On Time
Share of orders delivered by the promised date.
In Full
Share of orders delivered with all items.
Order cycle time
Average days from order to delivery.
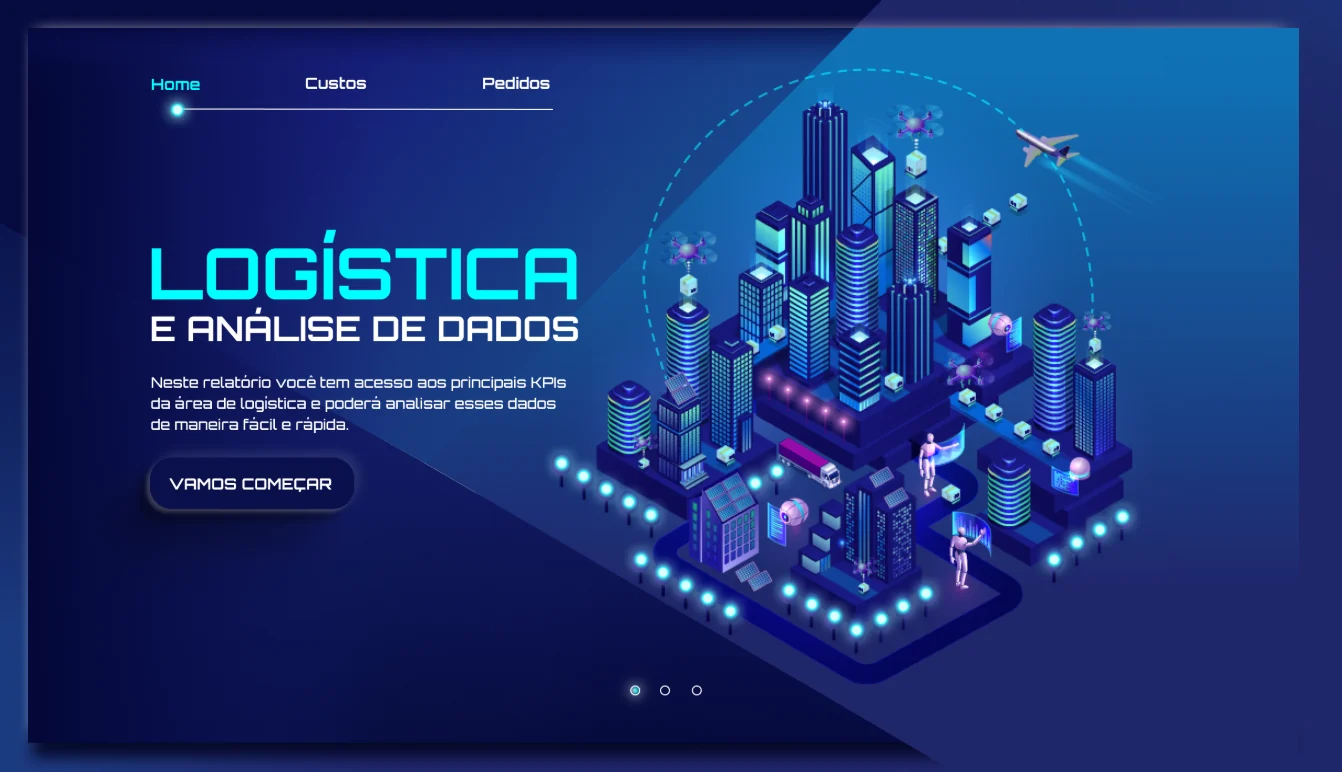
Start page: "Logistics and data analysis. In this report you can see the main logistics KPIs and analyse them quickly and easily."

Translation guide

The dashboard was built in Portuguese. Use this table to read the screen.

On screen (Portuguese)In English
Análise de pedidosOrder analysis
Qtd de pedidosNumber of orders
Ano / Mês / TrimestreYear / month / quarter
FilialBranch
Fora do prazoLate
Pedidos com ocorrência por motivoOrders with problems, by reason
Falta de pedidoMissing order
Preço errado / divergenteWrong / mismatched price
Estab. fechadoShop closed
Desistência clienteCustomer cancelled
Estado e cidadeState and city
Custos / PedidosCosts / Orders
All projects
Brazil · Grupo Petrópolis

A real-time app for truck drivers to report problems

Truck drivers on the road had no fast way to tell the workshop about a problem. They called or sent messages, and requests got lost.

Open the live dashboardOpens Power BI in a new tab. The report labels are in Portuguese; the translation guide is below.

All numbers in this dashboard are changed to protect privacy and confidential data. The design and logic are my real work.
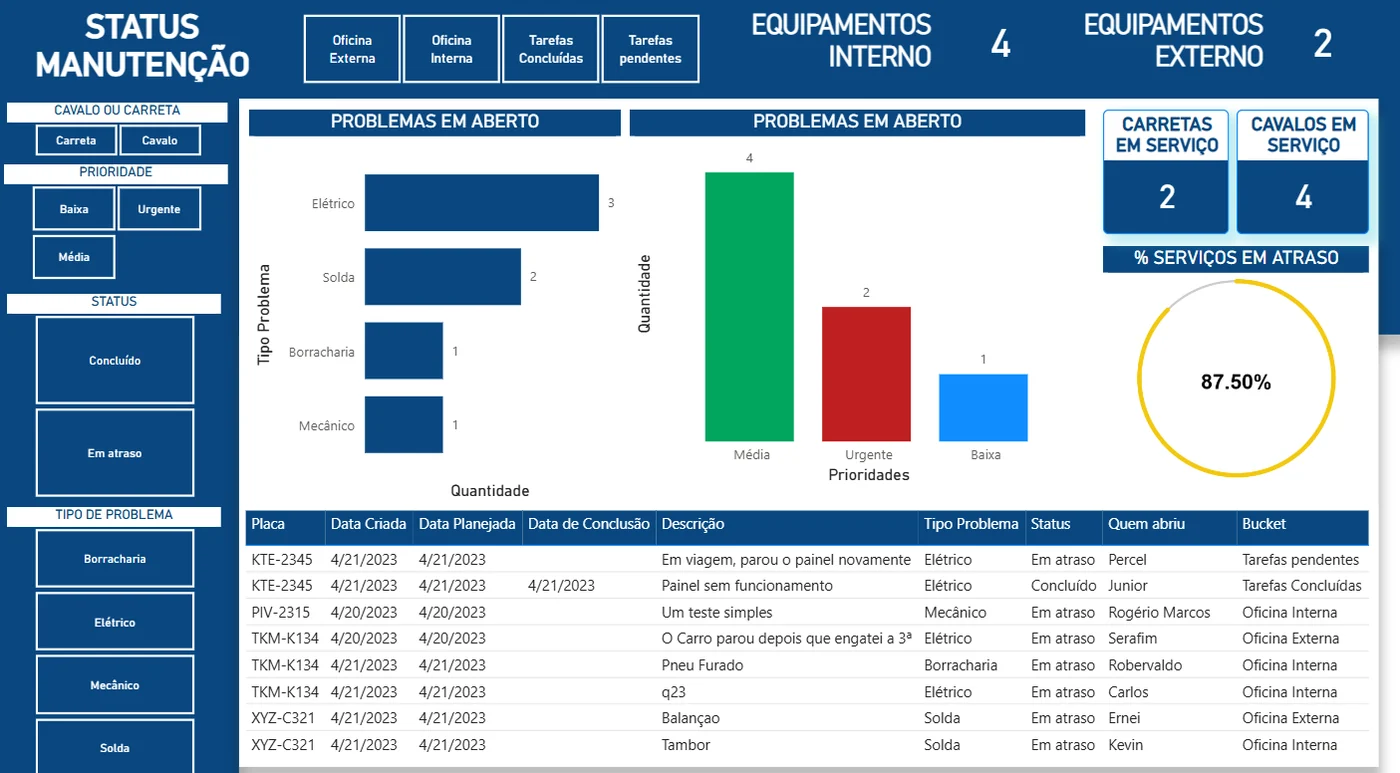
Power BI maintenance status board in Portuguese: open problems by type and priority, trailers and prime movers in service, 87.5% of jobs overdue, and a table of jobs by plate.
Client
Grupo Petrópolis
Context
Fleet & logistics
When
2022–2023
My role
Power Platform Developer
Tools
Power AppsPower AutomatePower BISharePoint

The problem

The Maintenance Planning team could not see all open problems in one place, or which jobs were late.

What I built

  • Built a PowerApps app so drivers can report a problem from the road, with the truck's plate, problem type and description.
  • Created Power Automate flows that alert the team and escalate urgent problems.
  • Built a live Power BI status board: open problems by type and priority, trucks in the internal or external workshop, and overdue jobs.
  • Added filters for prime mover or trailer, priority, status and problem type.

Key measures

Open problems
Reports not yet fixed, by problem type and by priority.
% jobs overdue
Share of jobs past their planned date.
In service
Prime movers and trailers currently in the workshop.

Translation guide

The dashboard was built in Portuguese. Use this table to read the screen.

On screen (Portuguese)In English
Status manutençãoMaintenance status
Oficina externa / internaExternal / internal workshop
Tarefas concluídas / pendentesCompleted / pending tasks
Cavalo / CarretaPrime mover / trailer
Prioridade: baixa, média, urgentePriority: low, medium, urgent
Concluído / Em atrasoDone / overdue
Elétrico / Mecânico / Solda / BorrachariaElectrical / mechanical / welding / tyres
Problemas em abertoOpen problems
% serviços em atraso% jobs overdue
PlacaPlate (rego)
Quem abriuReported by